Commercial Data Web Application
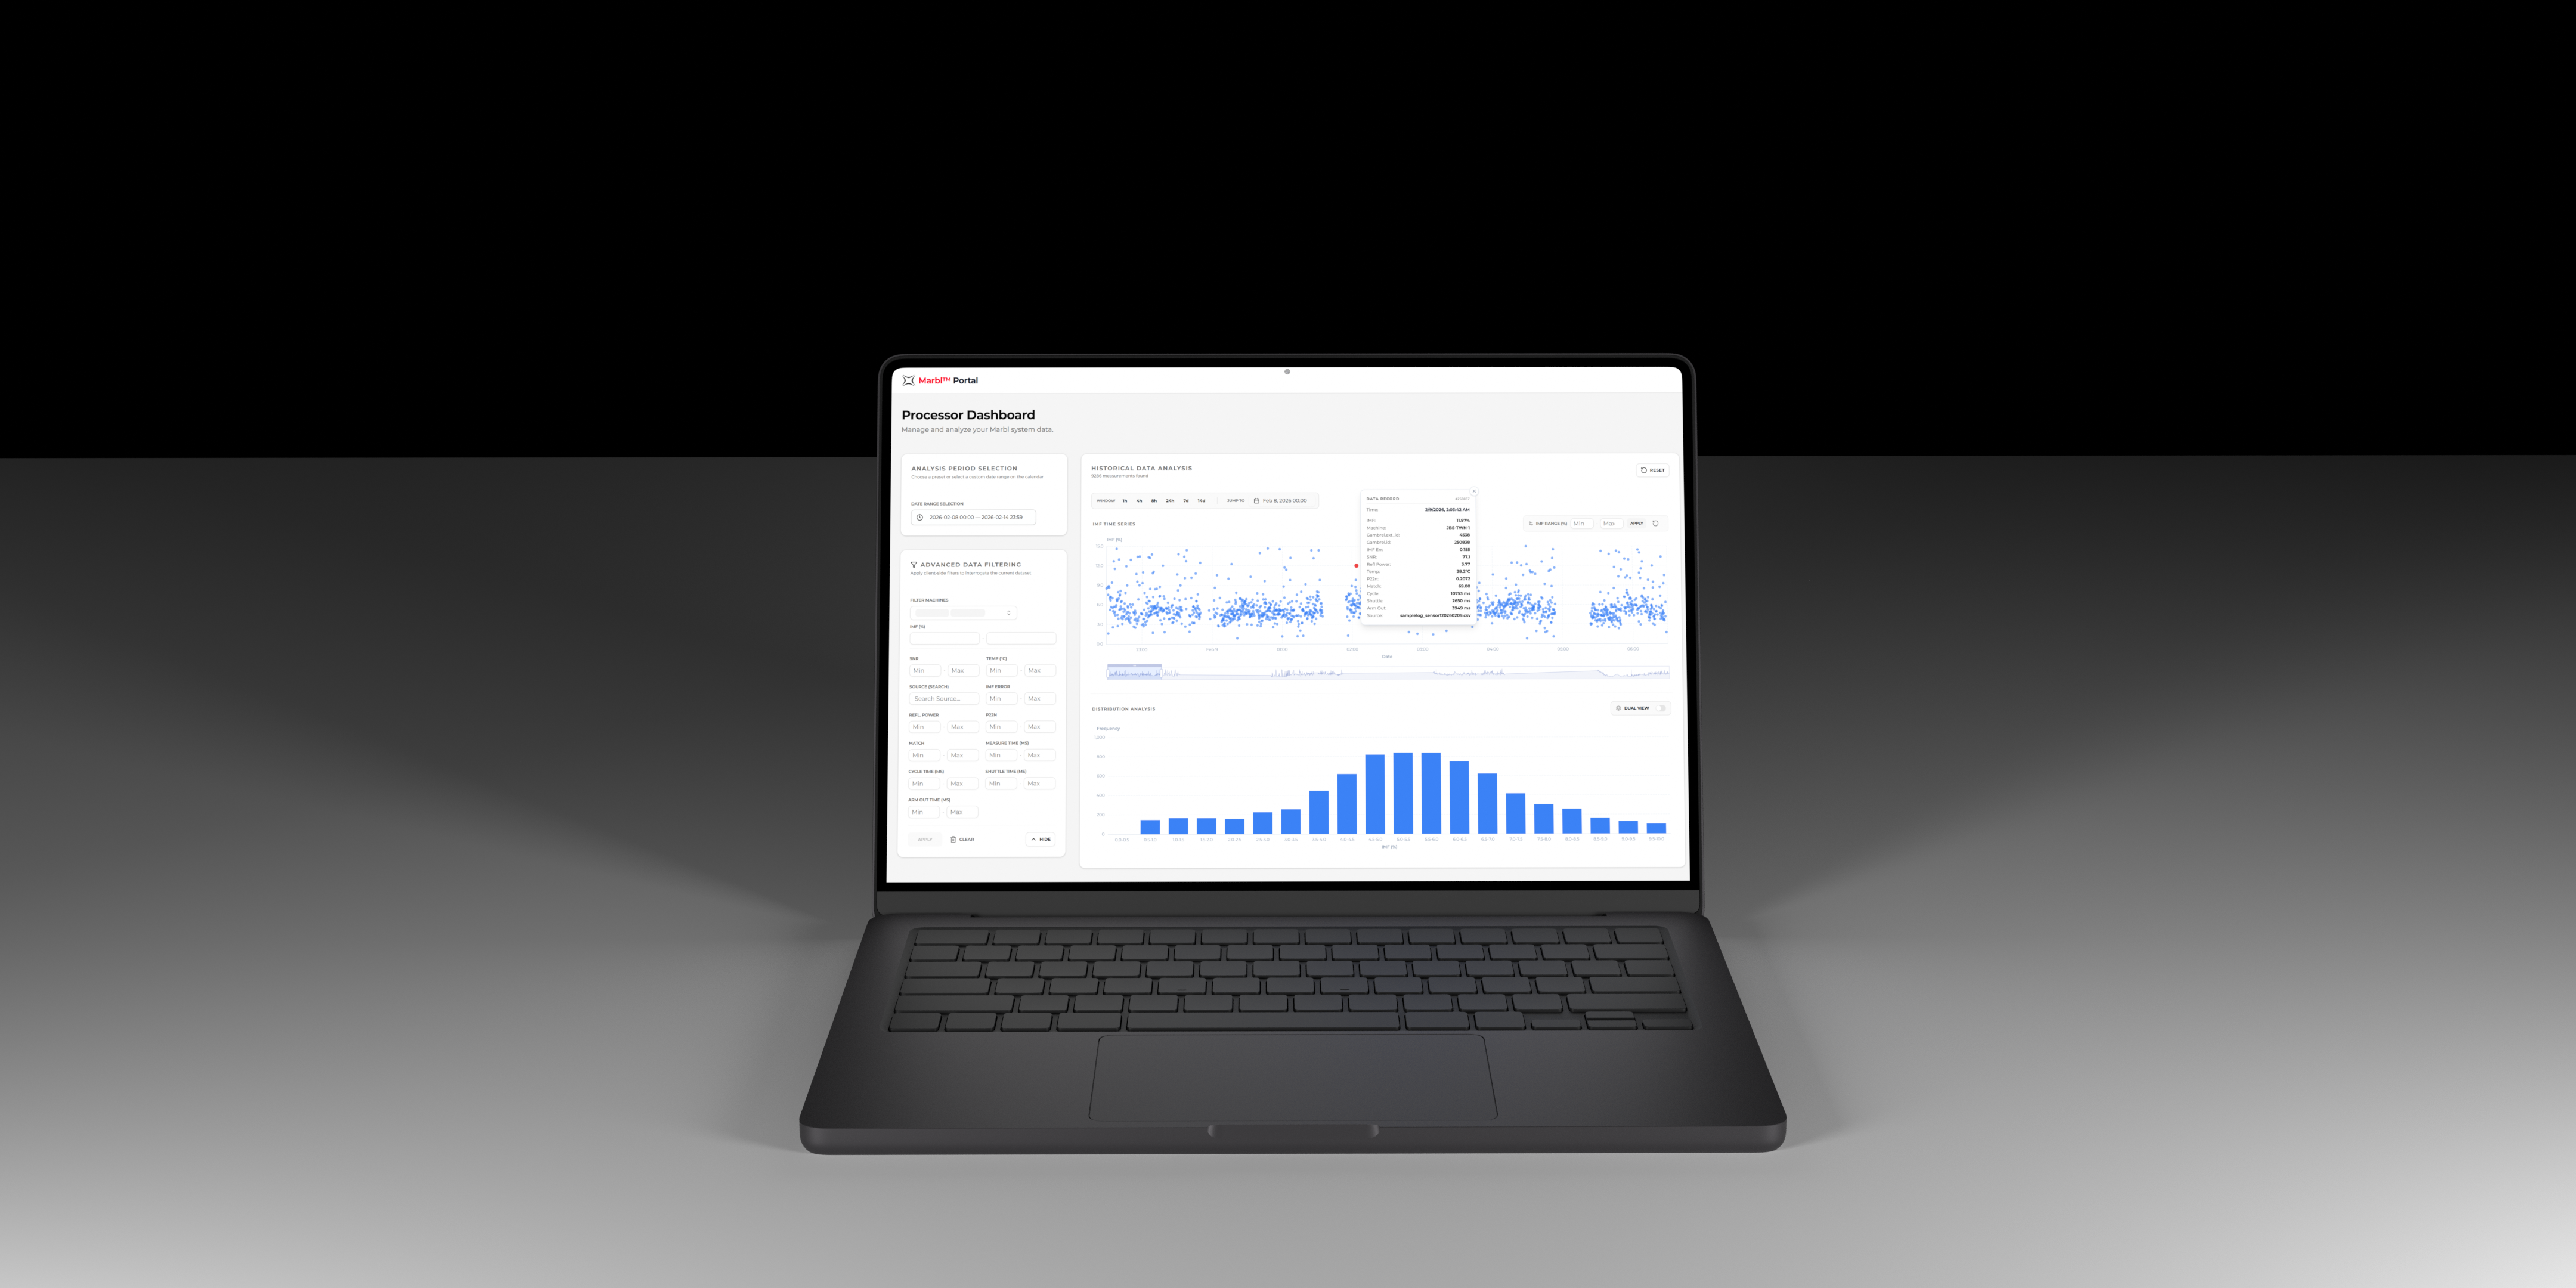
A data visualization dashboard built using FastAPI, SQL, and React, developed as a contracted commercial project.
Background
I was contracted by a local business operating in the New Zealand/Australia Lamb industry to build a dashboard to show off their data to clients, investors and research grant agencies.
Their core product is quite interesting - using Magnetic Resonance to measure intra-muscular fat of live sheep and lamb carcasses on the production line.
Their requirement was a system for internal and external customers to be able to view, and analyse the data generated from their different sensor configurations across Australia and New Zealand. The need to analyse historical and real-time data presented a good challenge for a bespoke full-stack web app, with a focus on dynamic charts, and a robust back-end to manage users, joined datasets and authentication.
Features
- A FastAPI backend with endpoints for users to access data, or for machines to upload real-time measurements with authentication/api key system.
- A React frontend powered by Apache ECharts for visualisation performance.
- Docker deployment system.
- A Python module to run on the edge machine to upload data in real-time.
Stack
- Backend: Python, FastAPI, SQLite, SQLAlchemy
- Frontend: TypeScript, React, Tailwind CSS, Apache ECharts, shadcn
- Deployment: Docker, Linux, Tailscale
Related Work
The web dashboard interface was also rendered in 3D and featured on the company’s trade show marketing banners for LambEx. View the Trade Show Banner Design project to see more.